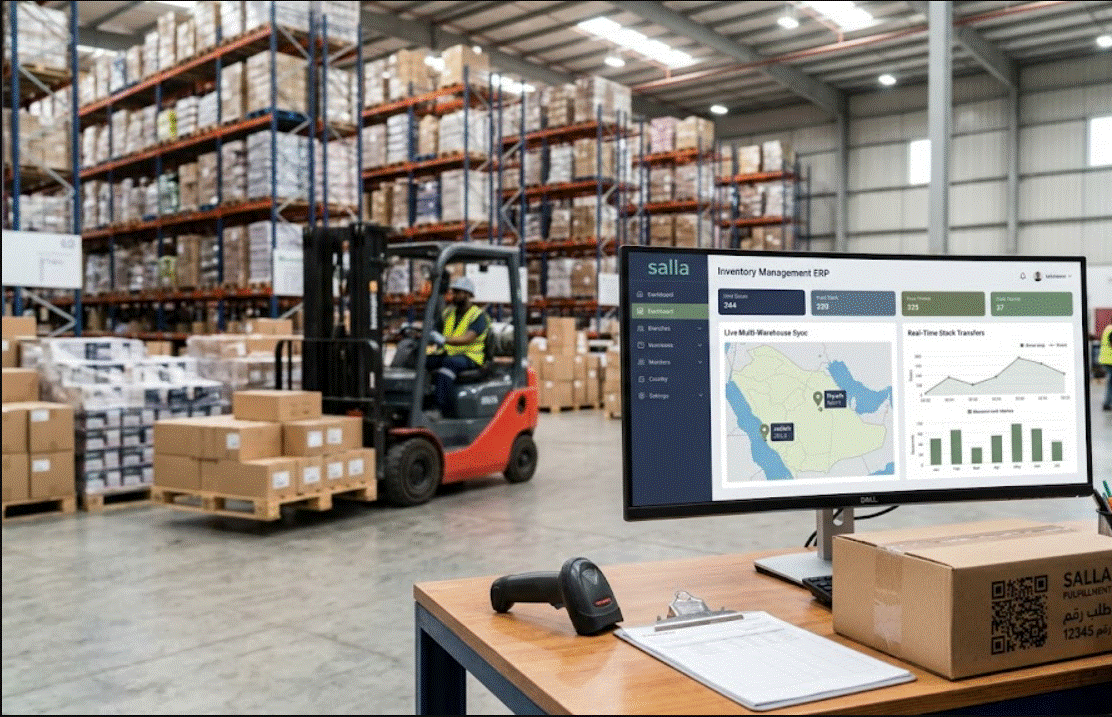
Watching a product go viral on your digital storefront is an exhilarating experience. However, the thrill of a massive sales spike is quickly shattered when you realize you have accidentally oversold a product you no longer have in stock. In the fast-paced world of modern E-commerce, managing inventory across multiple physical branches and distribution centers is a complex logistical puzzle. Relying on manual updates or basic, disconnected spreadsheets is a guaranteed way to bleed revenue and infuriate your customers.
As your brand scales on Salla—the leading e-commerce platform in the region—your operational infrastructure must evolve. A robust Salla inventory management strategy is no longer a luxury; it is the fundamental core of your business survival.
To sell non-stop without hitting operational roadblocks, your storefront must be deeply connected to a centralized system that orchestrates your multi-location logistics. In this comprehensive guide, we will explore the chaos of disconnected stock, how a seamless Salla ERP integration acts as your digital brain, the art of optimizing your Shipping routes, and how to keep your Suppliers perfectly aligned with your actual market demand.
Also read: How to Turn Your ERP System Reports into Profitable Strategic Business Decisions?
1. The Multi-Warehouse Dilemma: Defeating the “Out of Stock” Nightmare
When you first launch an online store, fulfilling orders from a single backroom or garage is manageable. However, as your enterprise expands into multiple retail branches, regional distribution hubs, and third-party logistics (3PL) centers, visibility becomes your greatest enemy.
The Disconnected Data Trap
If your Salla store does not know exactly what sits on the shelves of your Riyadh branch versus your Jeddah warehouse, you are operating blindly. A customer might see a dreaded Out of stock message on your website for a flagship product, completely unaware that there are 50 units sitting idle in a secondary branch location. You lose the sale not because you lacked the product, but because you lacked the visibility.
Conversely, if stock is not updated instantaneously across all platforms, two customers might purchase the same final unit simultaneously—one online and one walking into your physical store. The resulting forced cancellation permanently damages your brand reputation.
2. Unifying Operations with Salla ERP Integration
The ultimate solution to multi-warehouse chaos is bridging your customer-facing digital storefront with a backend Enterprise Resource Planning (ERP) system.
The Real-Time Synchronization Engine
A premium Salla ERP integration acts as the central nervous system of your retail empire. When integrated, your ERP consolidates the stock levels from every single physical location into one unified digital ledger.
When a customer views an item on your Salla store, they are seeing the live, combined aggregate of your Warehouse inventory. The exact second an item is purchased—whether via a digital checkout or at a physical Point of Sale (POS) terminal in one of your branches—the ERP instantly deducts that item across the entire network. This bi-directional sync absolutely guarantees that you never double-sell a product and ensures that every available unit in your company is actively working to generate revenue.
Disconnected Operations vs. Integrated Multi-Warehouse Management
| Operational Challenge | Disconnected Salla Store | Integrated ERP Multi-Warehouse System |
|---|---|---|
| Stock Visibility | Fragmented; relies on manual daily tallies. | 100% unified, real-time visibility across all branches. |
| Order Routing | Manual allocation; high risk of human error. | Automated routing to the warehouse closest to the customer. |
| Inventory Accuracy | High risk of phantom stock and overselling. | Flawless accuracy; live deductions at the millisecond of sale. |
| Store Replenishment | Reactive; stores frequently run empty. | Proactive; automated transfer alerts when branch stock dips. |
3. Optimizing Shipping and Elevating Order Tracking
Effective Salla inventory management goes beyond just knowing what you have; it dictates how quickly and cost-effectively you can deliver it to the consumer.
Geolocation-Based Order Routing
Operating multiple warehouses gives you a massive geographical advantage, provided your software is smart enough to use it. An advanced ERP utilizes intelligent routing logic. When a customer in Dammam places an order on your Salla store, the system automatically bypasses your main Riyadh warehouse and assigns the fulfillment ticket directly to your Eastern Province branch, assuming the item is in stock there.
This localized fulfillment slashes your Shipping costs, drastically reduces delivery times, and turns your physical retail branches into hyper-efficient micro-fulfillment centers.
Frictionless Customer Transparency
Once the order is allocated to the correct warehouse, the fulfillment team uses barcode scanners to pick and pack the item, instantly generating a courier label. This triggers a seamless data loop back to the customer. The ERP pushes live updates to the Salla storefront, providing the buyer with highly accurate Order tracking details. This automated transparency reduces customer anxiety and virtually eliminates the barrage of “Where is my order?” inquiries to your support team.
4. Aligning Suppliers with Real-Time Market Demand
Managing multi-location inventory is not just about pushing products out; it is equally about managing how products flow in.
When you operate multiple branches, manual procurement is a guessing game that leads to massive overstocking or crippling shortages. An integrated cloud accounting and inventory ERP continuously analyzes your Warehouse inventory depletion rates across every individual location.
Automated Reorder Points
You can set specific minimum stock thresholds for each branch. When a high-selling item drops below this threshold in a specific location, the system automatically generates a draft Purchase Order (PO). It can either request an internal transfer from a larger central warehouse or automatically alert your external Suppliers to deliver fresh stock directly to the depleted branch. This data-driven approach keeps your cash flow fluid, ensuring capital is not trapped in dead stock while your best-sellers remain perpetually available.
Key Metrics for Warehouse Inventory Optimization
| Key Performance Indicator (KPI) | What It Measures | Strategic Value for E-commerce |
|---|---|---|
| Inventory Turnover Ratio | How often inventory is sold and replaced over a period. | Identifies fast-moving products to prioritize with Suppliers. |
| Order Fill Rate | Percentage of orders successfully fulfilled without backorders. | Directly correlates with customer satisfaction and brand loyalty. |
| Carrying Cost of Inventory | The financial cost of storing unsold goods across branches. | Highlights the necessity of liquidating dead stock to free up capital. |
| Order to Ship Time | Time elapsed between checkout and package dispatch. | Proves the efficiency of your internal picking and Shipping workflows. |
Conclusion: Scale Your E-commerce Empire Without Limits
Managing a multi-branch retail network alongside a booming digital storefront is a complex balancing act. If you rely on fragmented spreadsheets and manual data entry, your operational bottlenecks will inevitably cap your revenue potential and damage your brand’s reputation.
Mastering Salla inventory management requires stepping away from manual tracking and embracing automation. By deploying a deep Salla ERP integration, you transform your isolated physical stores into a highly synchronized, unified logistical network. You empower your team to optimize Shipping routes, provide flawless Order tracking, intelligently manage your Suppliers, and completely eradicate the fear of the Out of stock button. Integrate your systems today, and build an infrastructure that is truly built to sell non-stop.
Frequently Asked Questions (FAQs)
A smart ERP system utilizes "waterfall" routing logic. If a customer in Jeddah orders an item, the system first checks the Jeddah branch. If the item is marked as out of stock there, the system automatically cascades the fulfillment request to the next closest location (e.g., the Riyadh central warehouse) that currently holds the Warehouse inventory, ensuring the sale is captured and fulfilled without requiring manual intervention.
Yes. While the system provides a unified global view of your inventory, advanced settings allow you to implement "virtual ring-fencing." You can reserve a specific percentage or quantity of your stock exclusively for E-commerce sales on Salla, ensuring that a sudden rush of in-store foot traffic does not completely wipe out your digital inventory availability.
No, a professional integration is designed to be seamless and non-disruptive. The initial synchronization happens in the background, matching your existing Salla SKUs with the newly created ERP database. Once the mapping is perfectly aligned and tested, the live bi-directional sync is activated without your customers ever experiencing storefront downtime.
Omnichannel flexibility is a major benefit of ERP integration. When a customer returns an online order to a physical branch, the cashier processes the return via the branch's connected POS terminal. The system instantly refunds the customer, voids the original digital invoice, and immediately adds the physical item back into the specific branch's local Warehouse inventory, making it available for sale again within seconds.